Takes a prior object and plots the selected implied prior
Usage
# S3 method for class 'emc.prior'
plot(
  x,
  selection = "mu",
  do_plot = TRUE,
  covariates = NULL,
  layout = NA,
  N = 5000,
  ...
)
Arguments
- x
An
emc_priorelement- selection
A Character string. Indicates which parameter type to use (e.g.,
alpha,mu,sigma2,correlation).- do_plot
Boolean. If
FALSEwill only return prior samples and omit plotting.- covariates
dataframe/functions as specified by the design
- layout
A vector indicating which layout to use as in par(mfrow = layout). If NA, will automatically generate an appropriate layout.
- N
Integer. How many prior samples to draw
- ...
Optional arguments that can be passed to get_pars, histogram, plot.default (see par()), or arguments required for the types of models e.g. n_factors for type = "factor"
Examples
# \donttest{
# First define a design for the model
design_DDMaE <- design(
data = forstmann, model = DDM,
formula = list(v ~ 0 + S, a ~ E, t0 ~ 1, s ~ 1, Z ~ 1, sv ~ 1, SZ ~ 1),
constants = c(s = log(1))
)
#> Parameter(s) st0 not specified in formula and assumed constant.
#>
#> Sampled Parameters:
#> [1] "v_Sleft" "v_Sright" "a" "a_Eneutral" "a_Eaccuracy"
#> [6] "t0" "Z" "sv" "SZ"
#>
#> Design Matrices:
#> $v
#> S v_Sleft v_Sright
#> left 1 0
#> right 0 1
#>
#> $a
#> E a a_Eneutral a_Eaccuracy
#> speed 1 0 0
#> neutral 1 1 0
#> accuracy 1 0 1
#>
#> $t0
#> t0
#> 1
#>
#> $s
#> s
#> 1
#>
#> $Z
#> Z
#> 1
#>
#> $sv
#> sv
#> 1
#>
#> $SZ
#> SZ
#> 1
#>
#> $st0
#> st0
#> 1
#>
# Then set up a prior using make_prior
p_vector <- c(
v_Sleft = -2, v_Sright = 2, a = log(1), a_Eneutral = log(1.5), a_Eaccuracy = log(2),
t0 = log(.2), Z = qnorm(.5), sv = log(.5), SZ = qnorm(.5)
)
psd <- c(
v_Sleft = 1, v_Sright = 1, a = .3, a_Eneutral = .3, a_Eaccuracy = .3,
t0 = .4, Z = 1, sv = .4, SZ = 1
)
# Here we left the variance prior at default
prior_DDMaE <- prior(design_DDMaE, mu_mean = p_vector, mu_sd = psd)
# Now we can plot all sorts of (implied) priors
plot(prior_DDMaE, selection = "mu", N = 1e2)
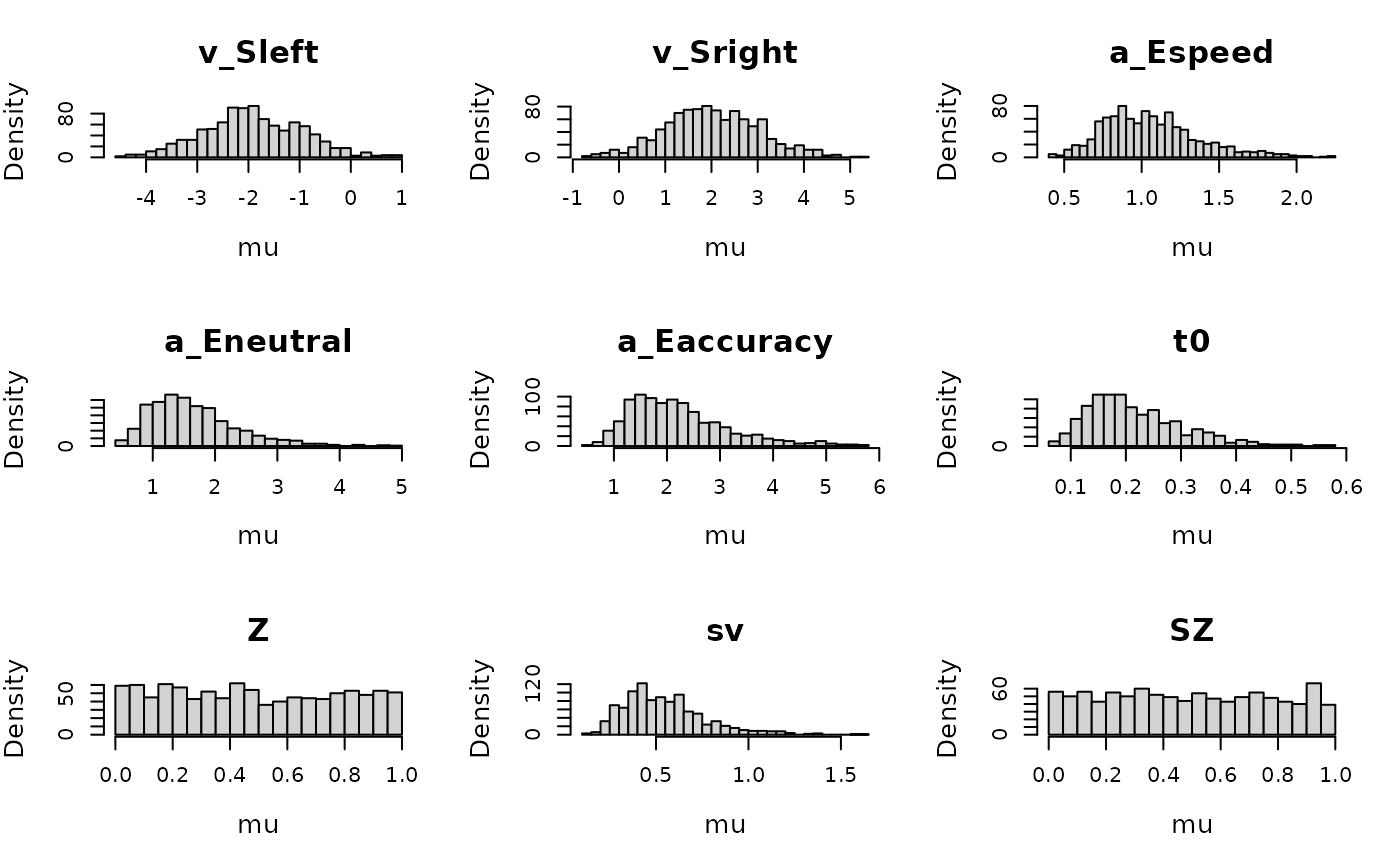
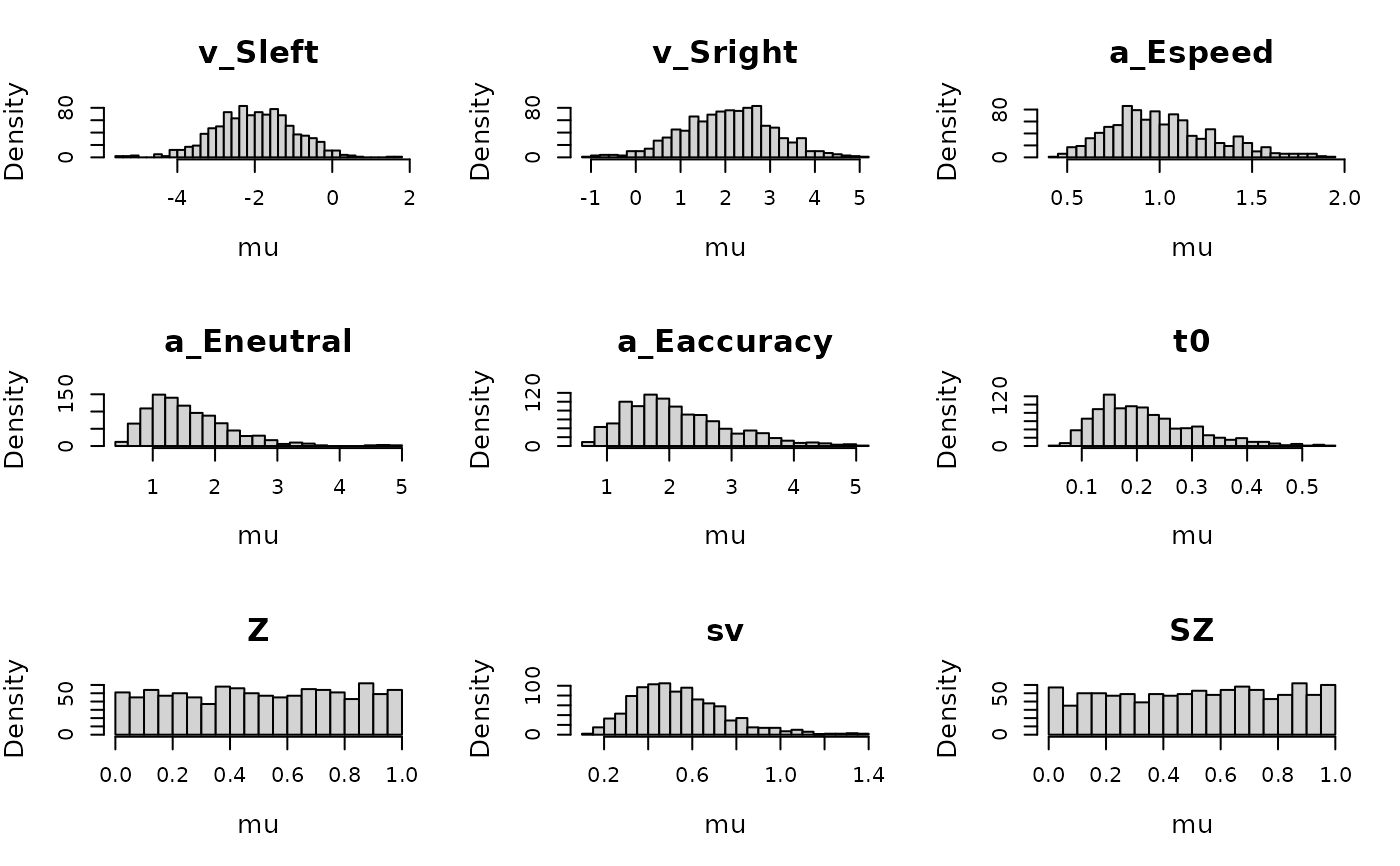 plot(prior_DDMaE, selection = "mu", mapped = FALSE, N = 1e2)
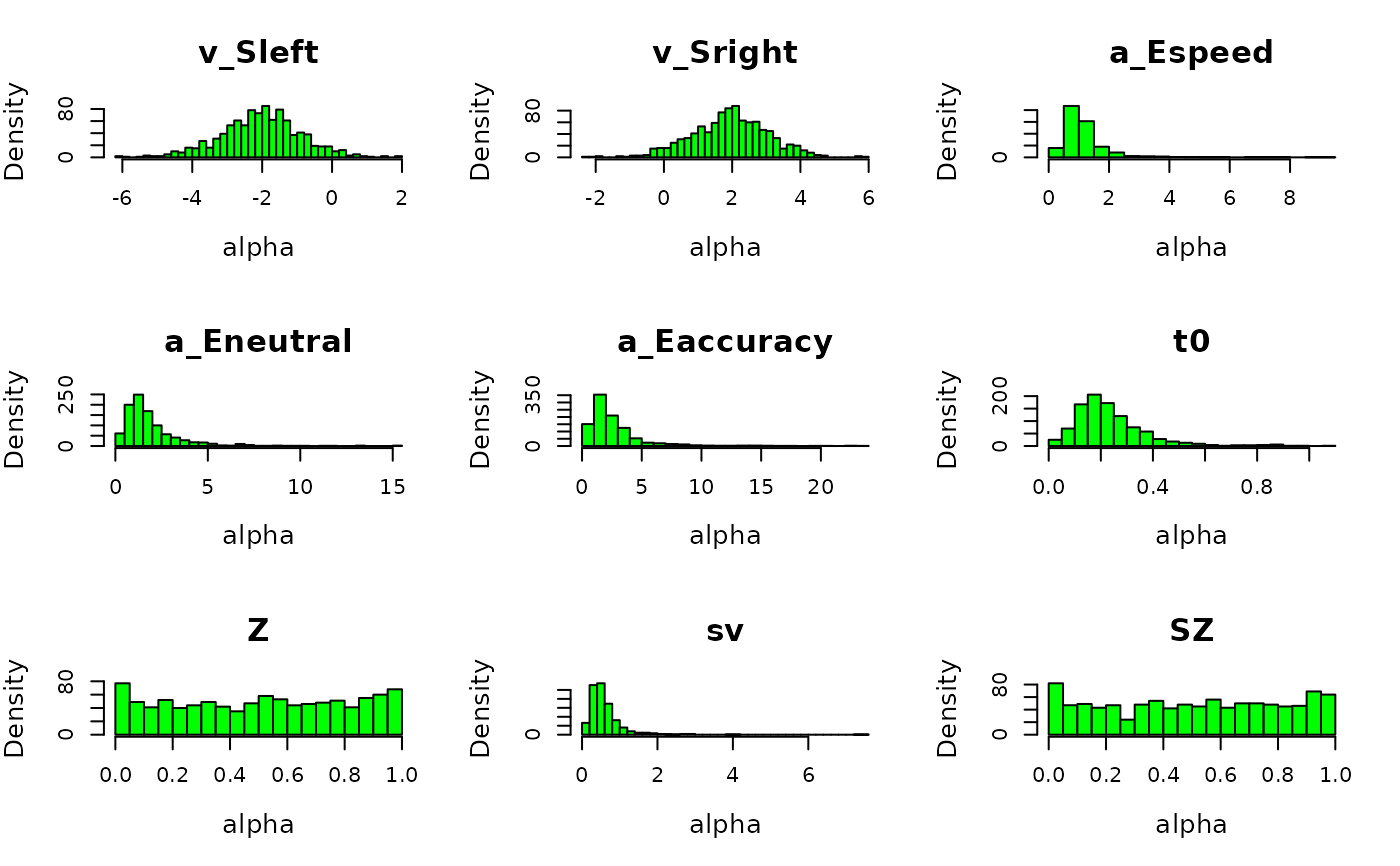
 # We can also plot the implied prior on the participant level effects.
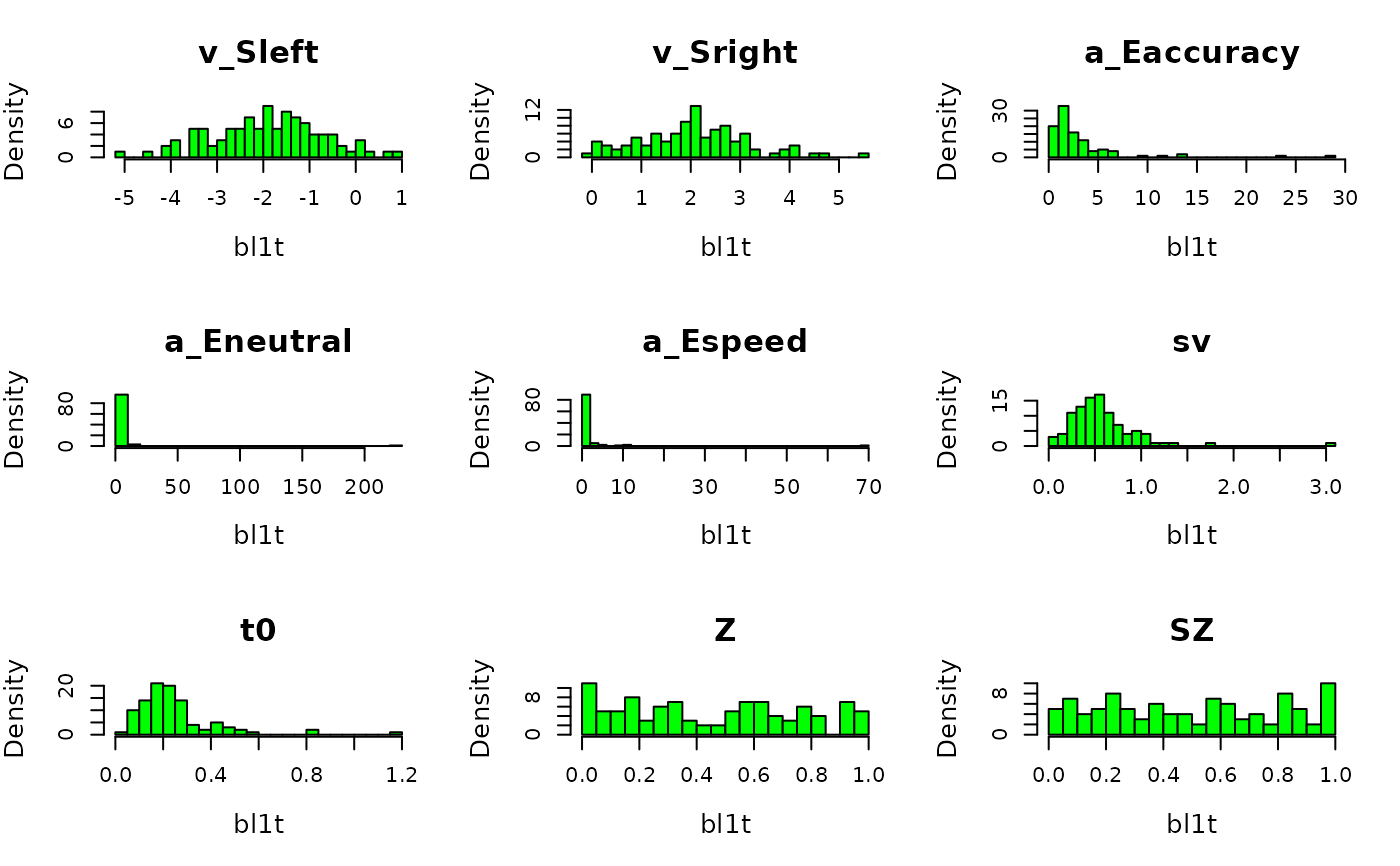
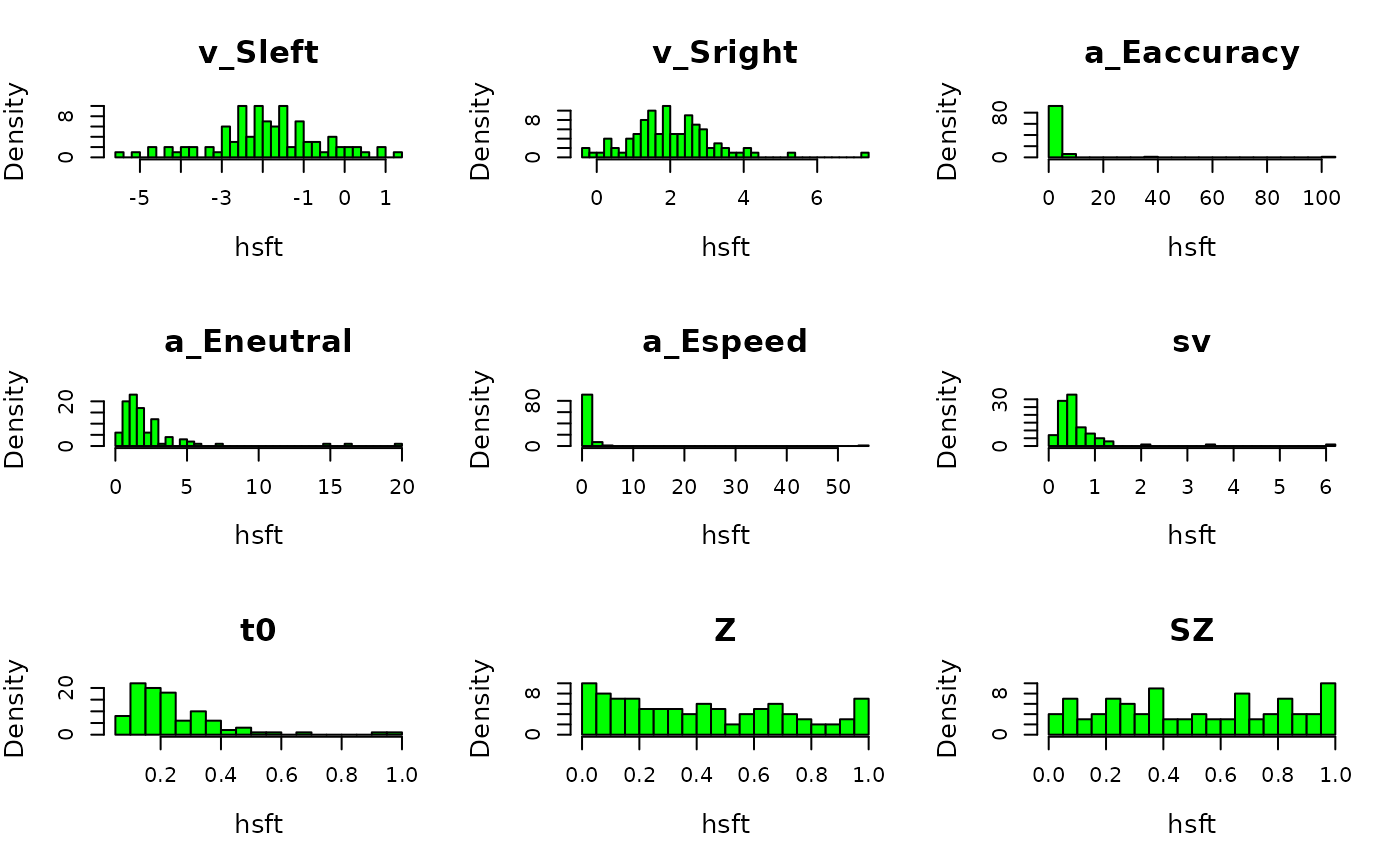
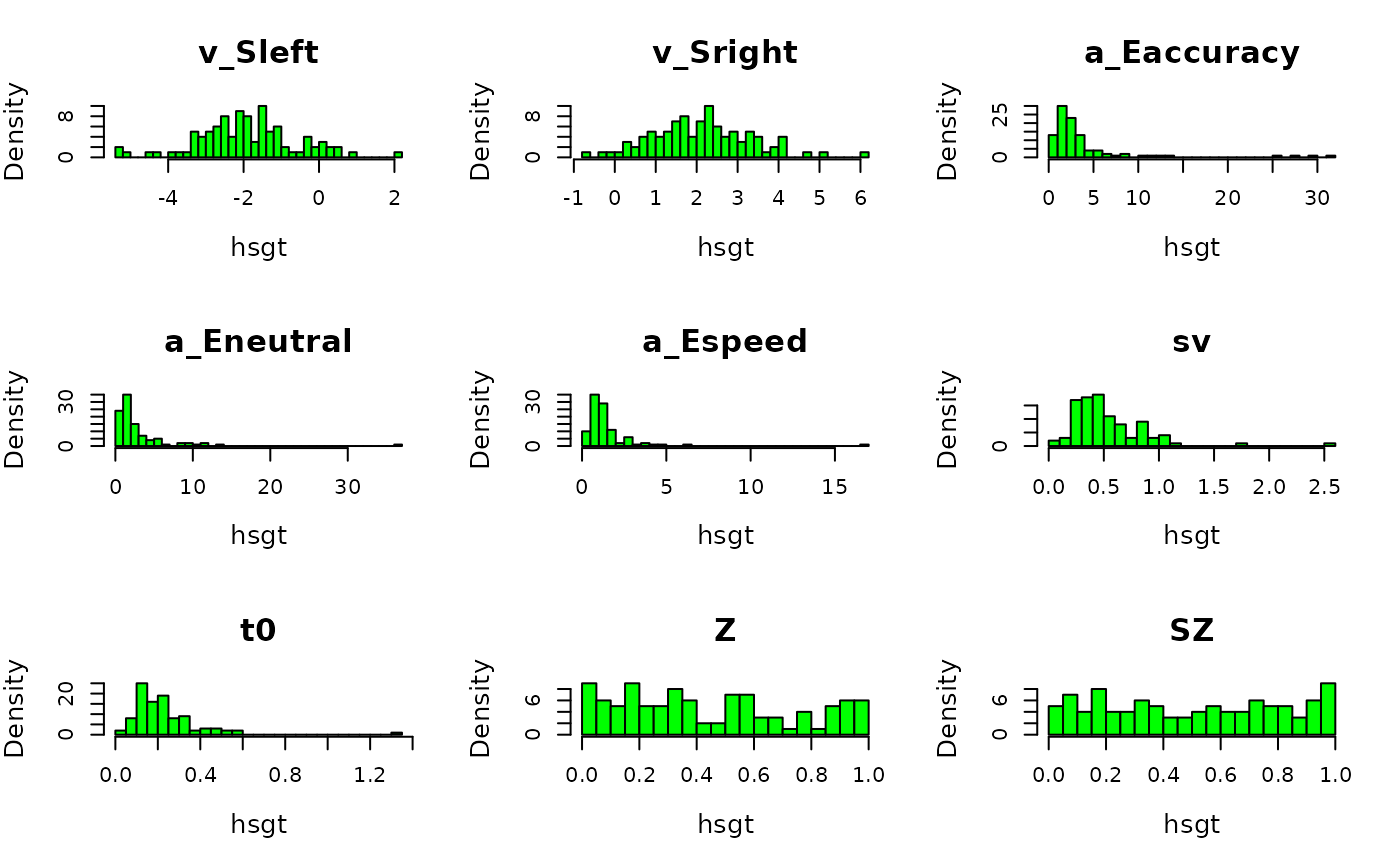
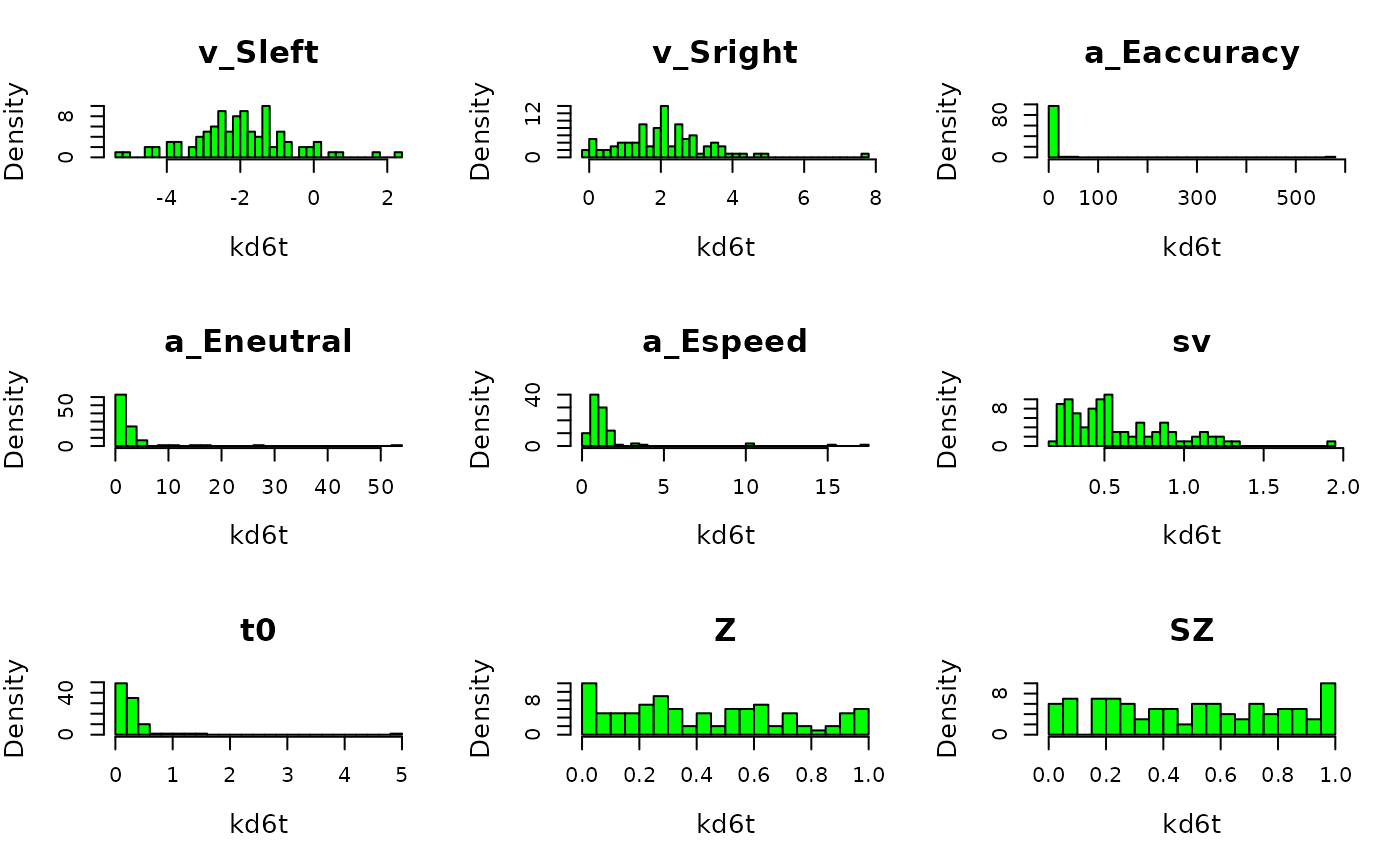
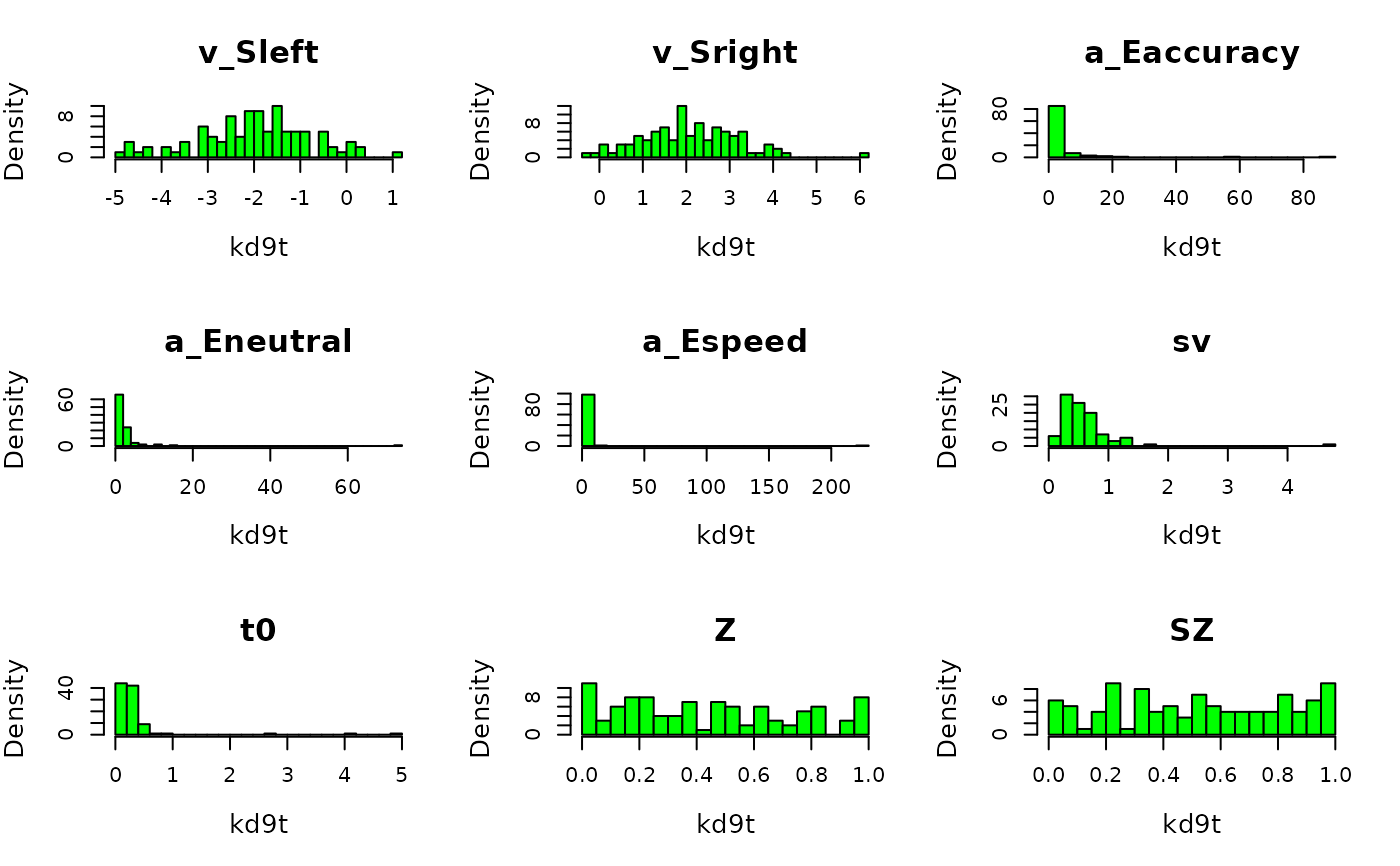
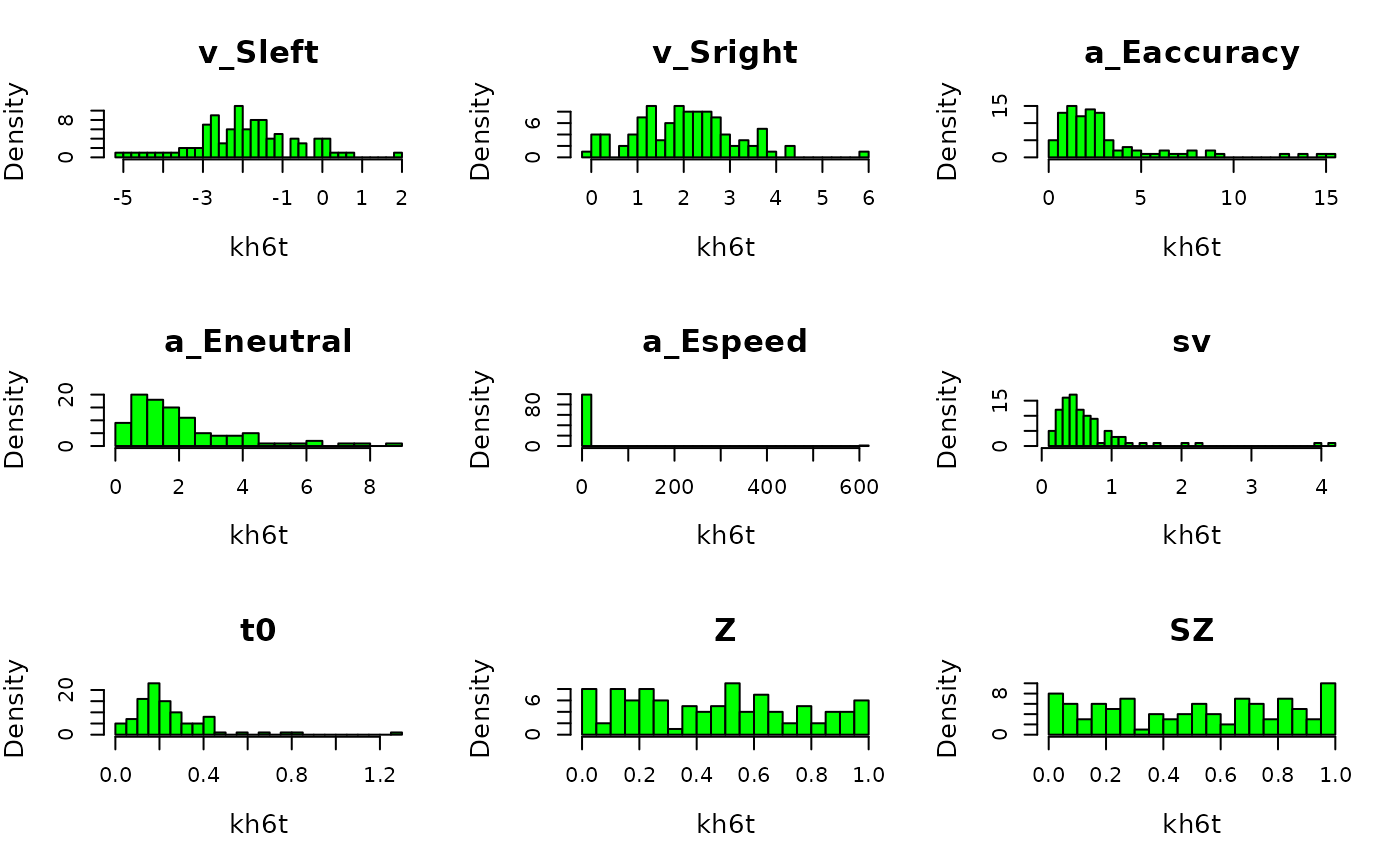
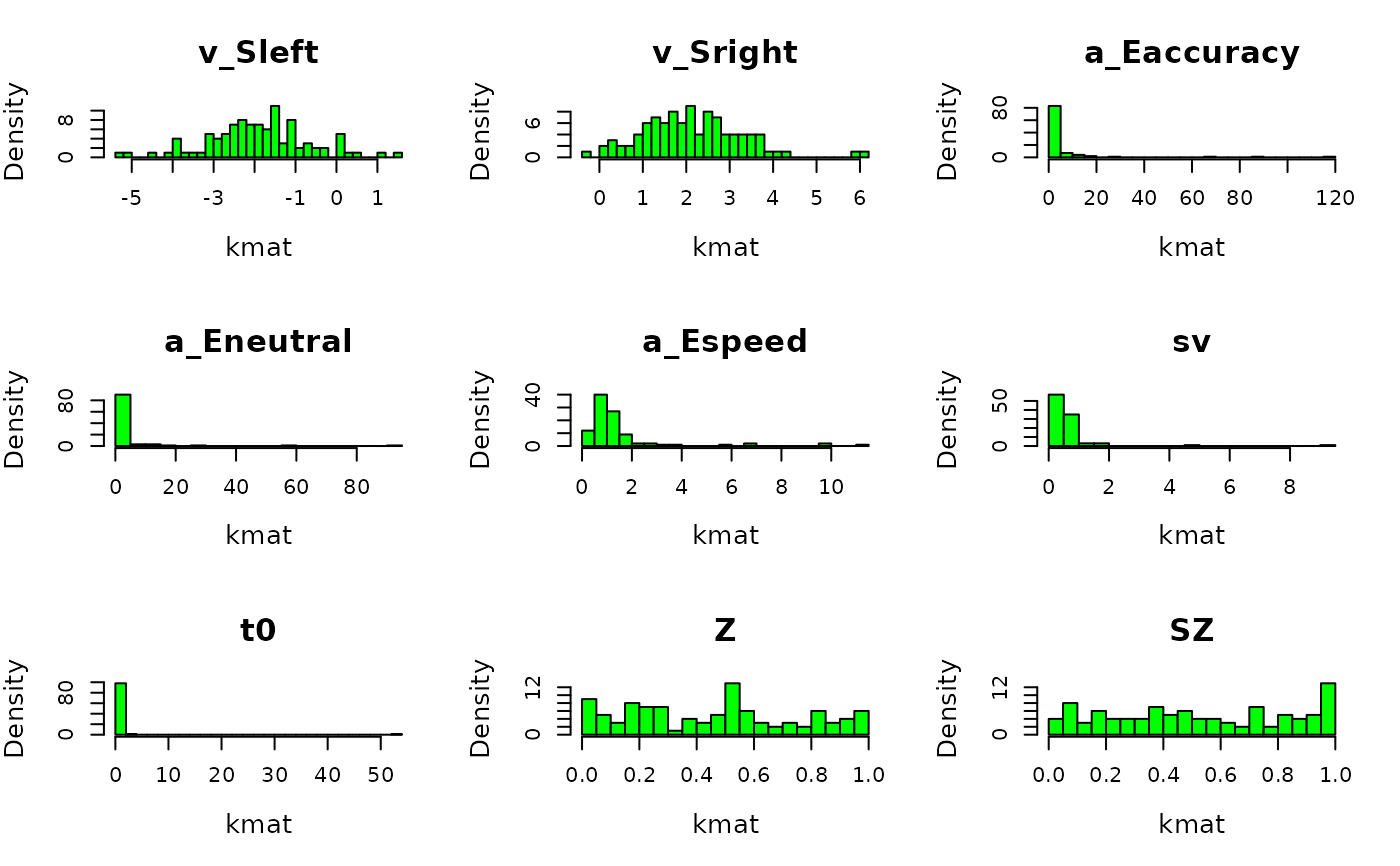
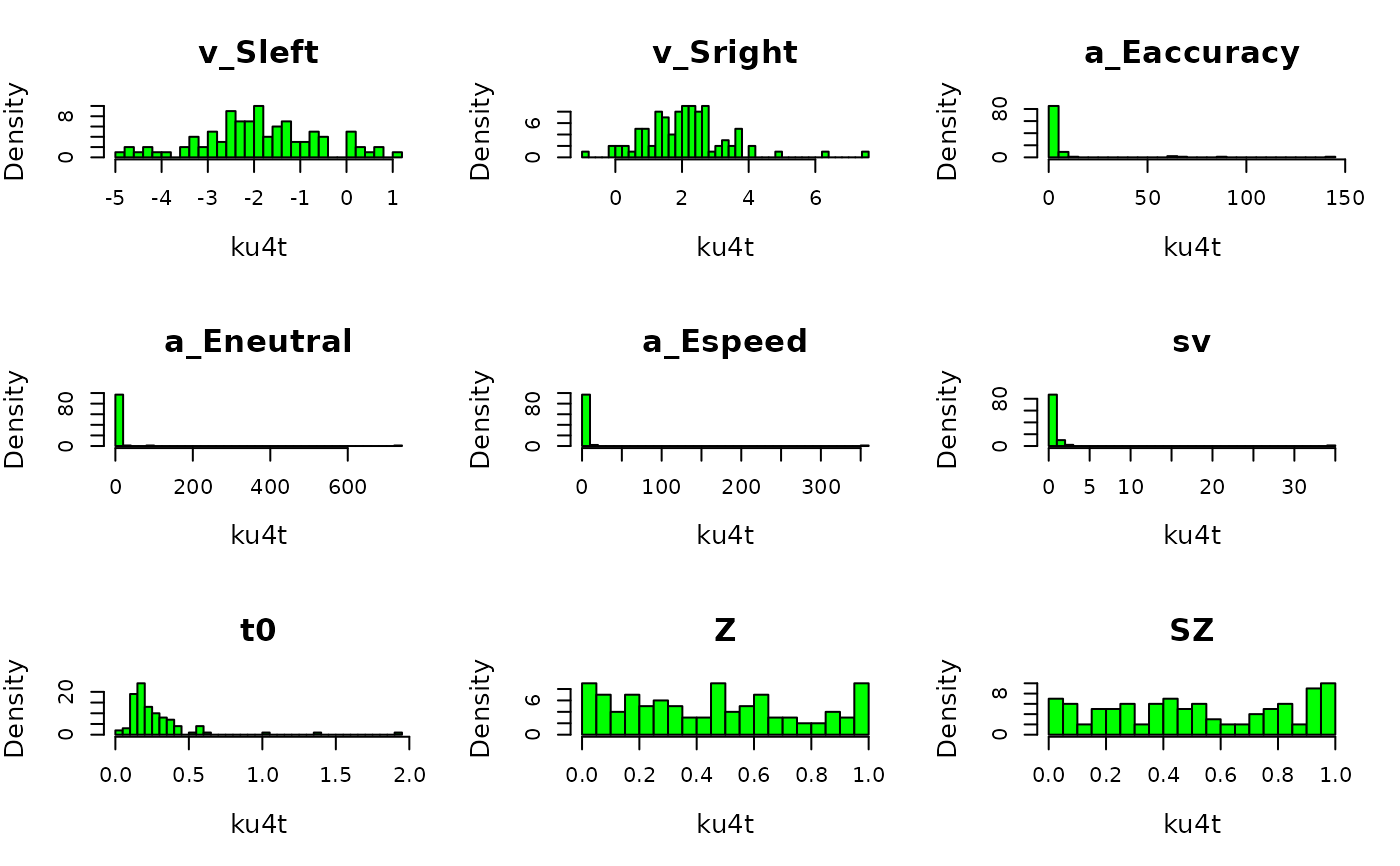
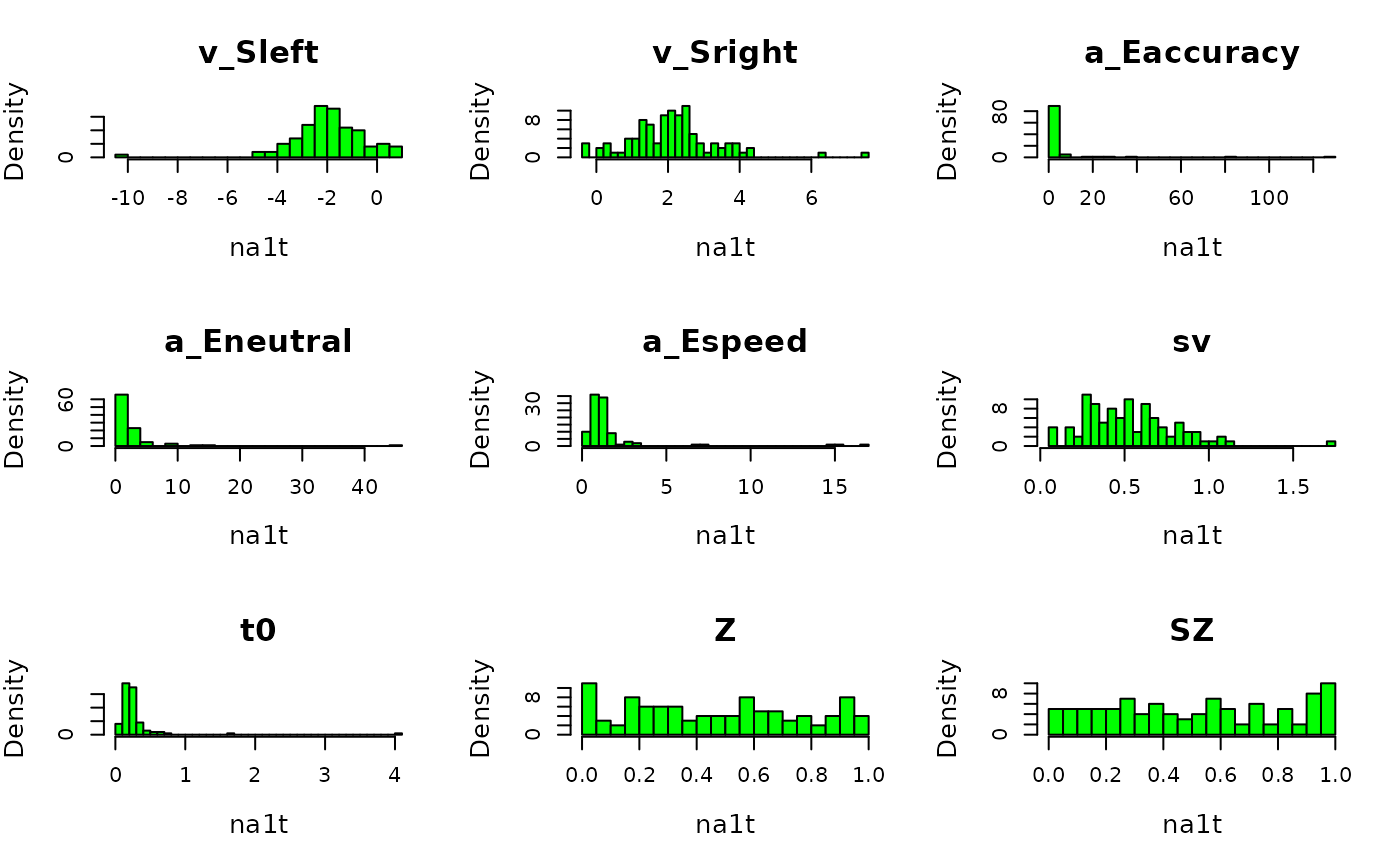
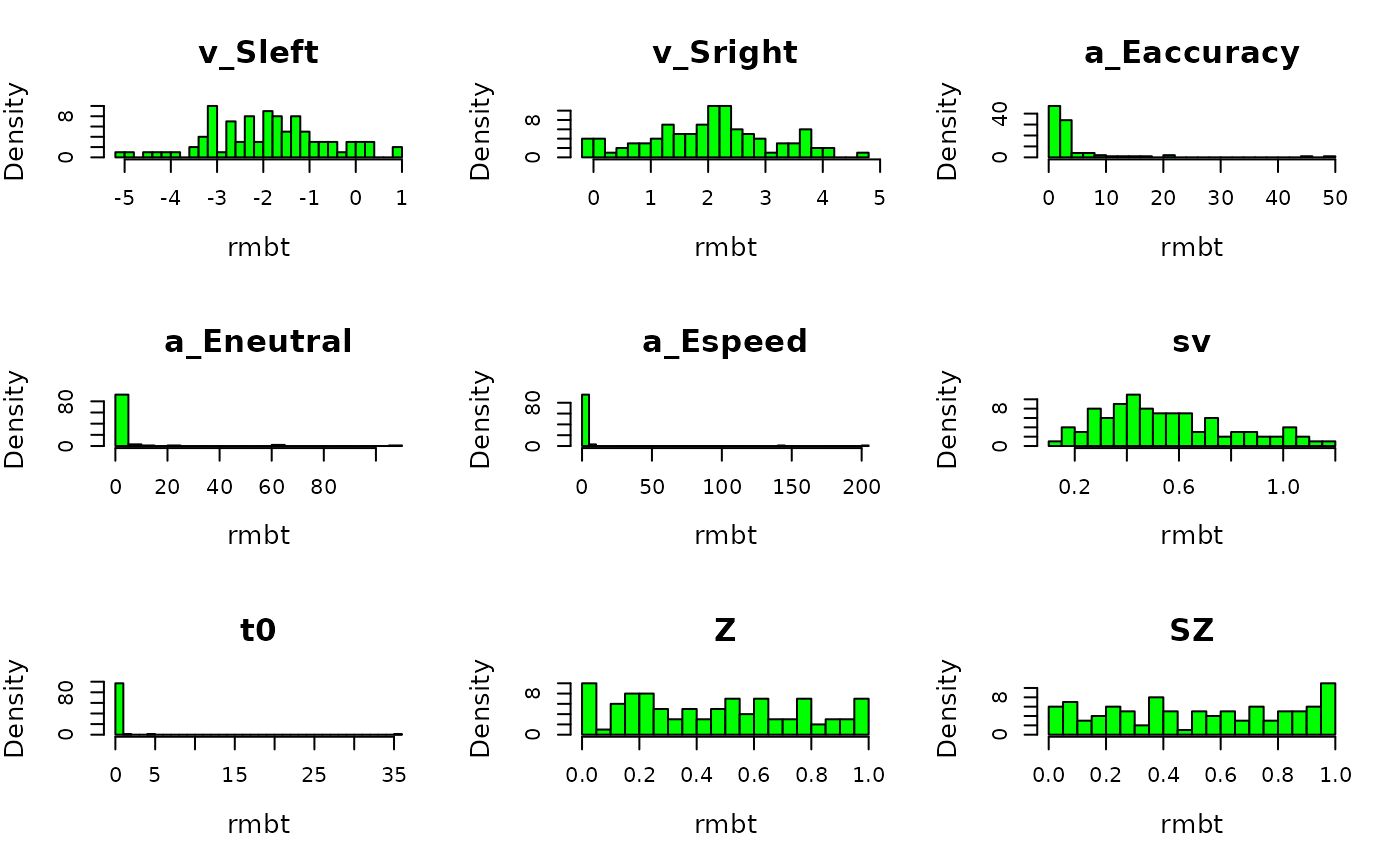
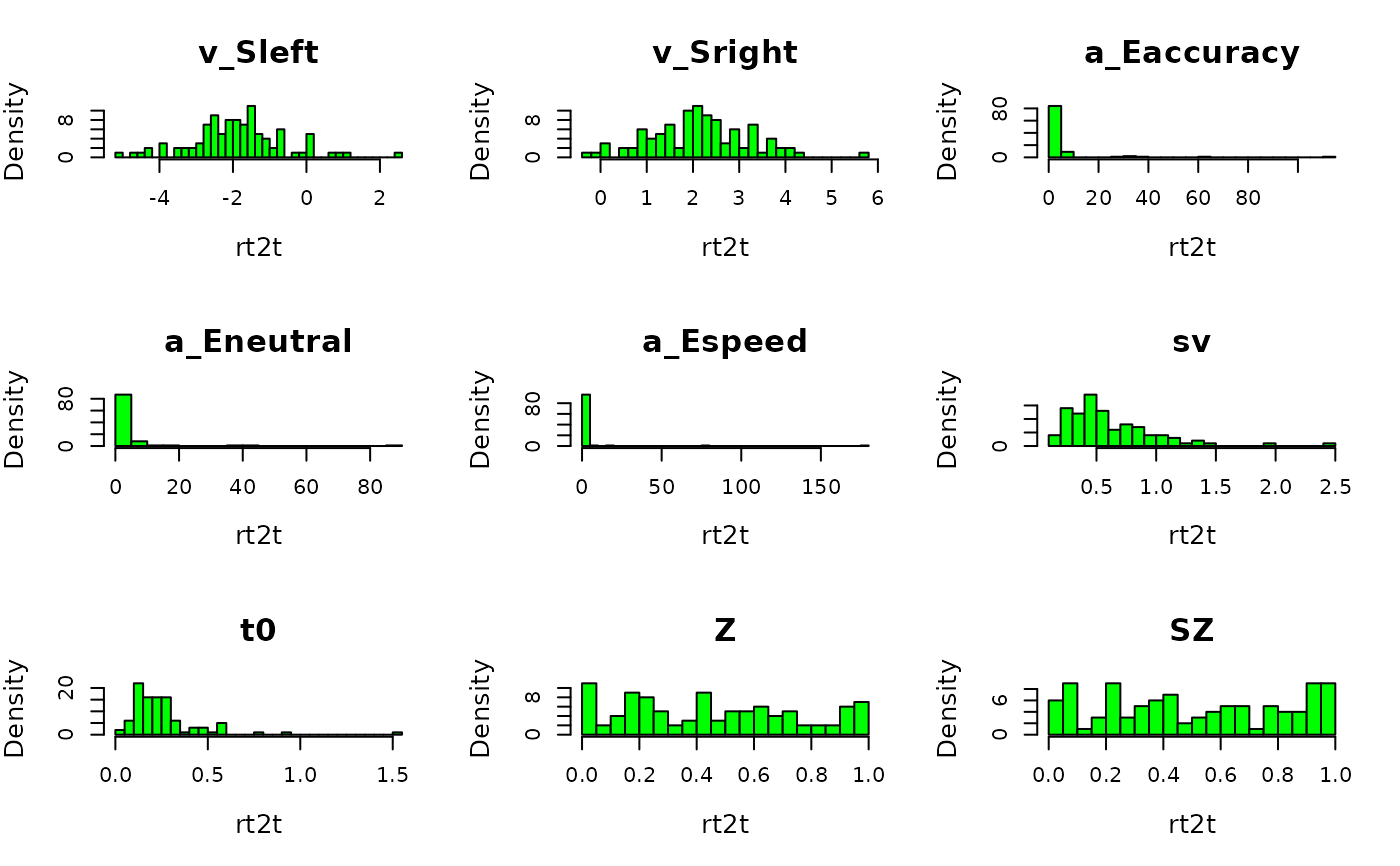
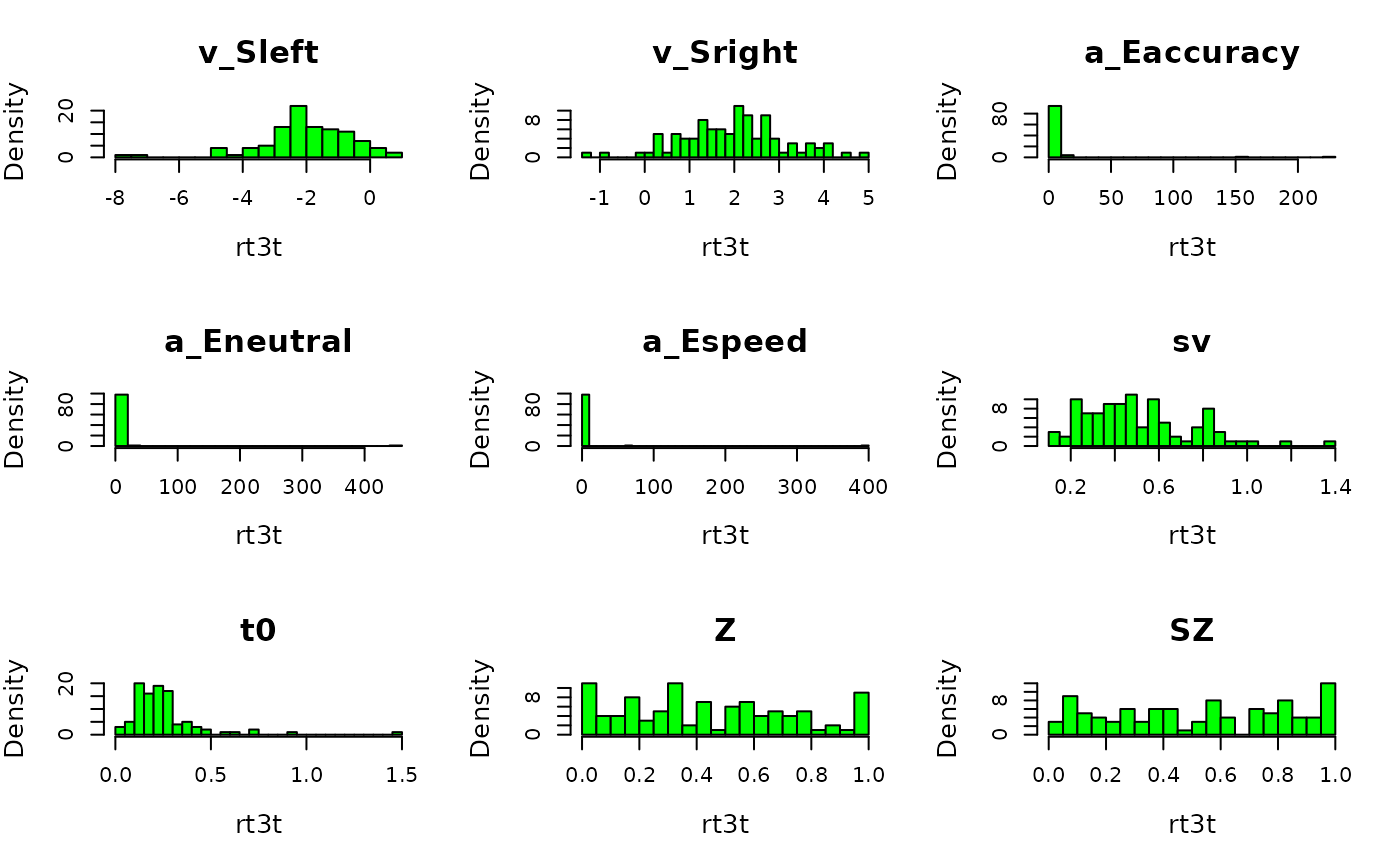
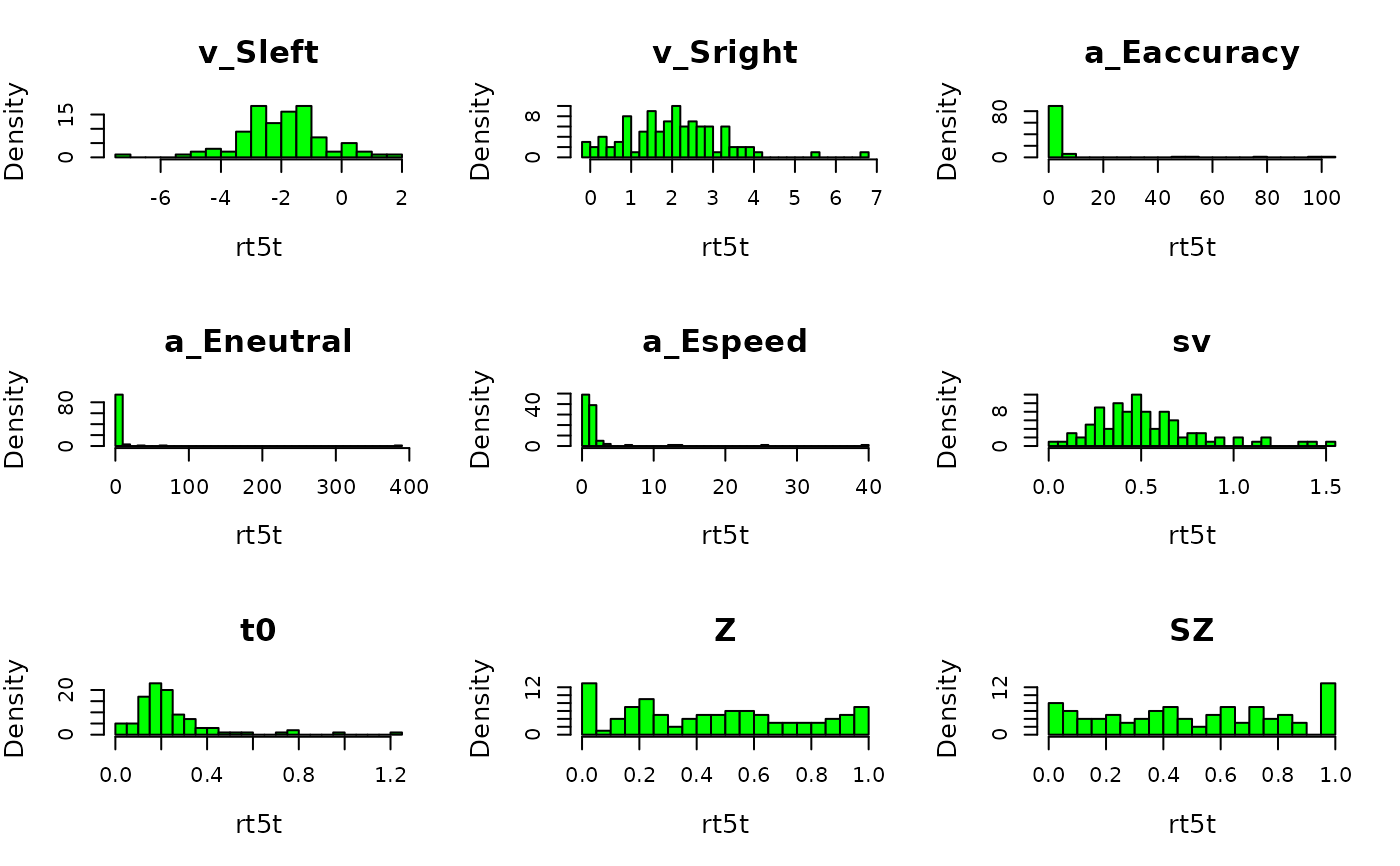
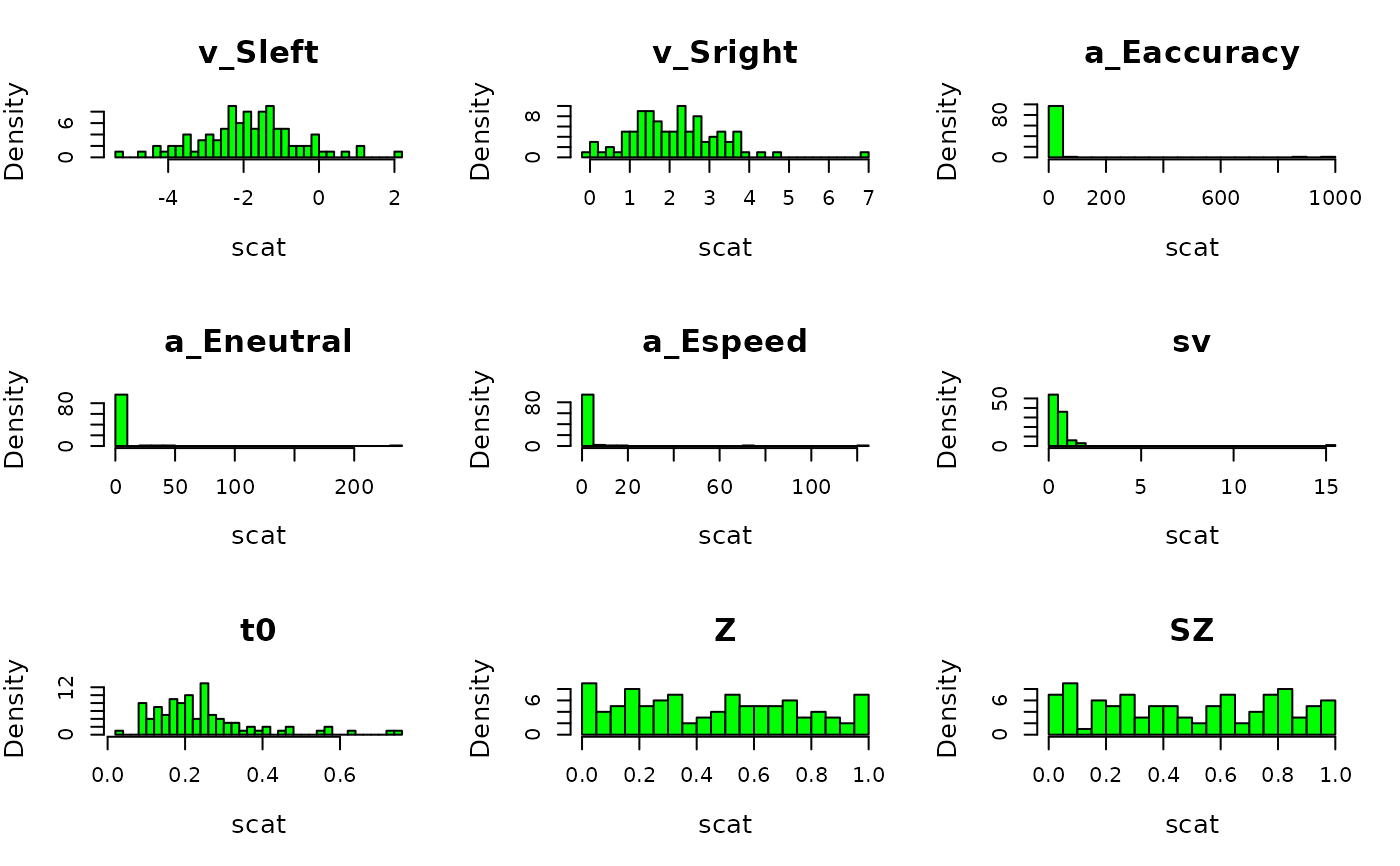
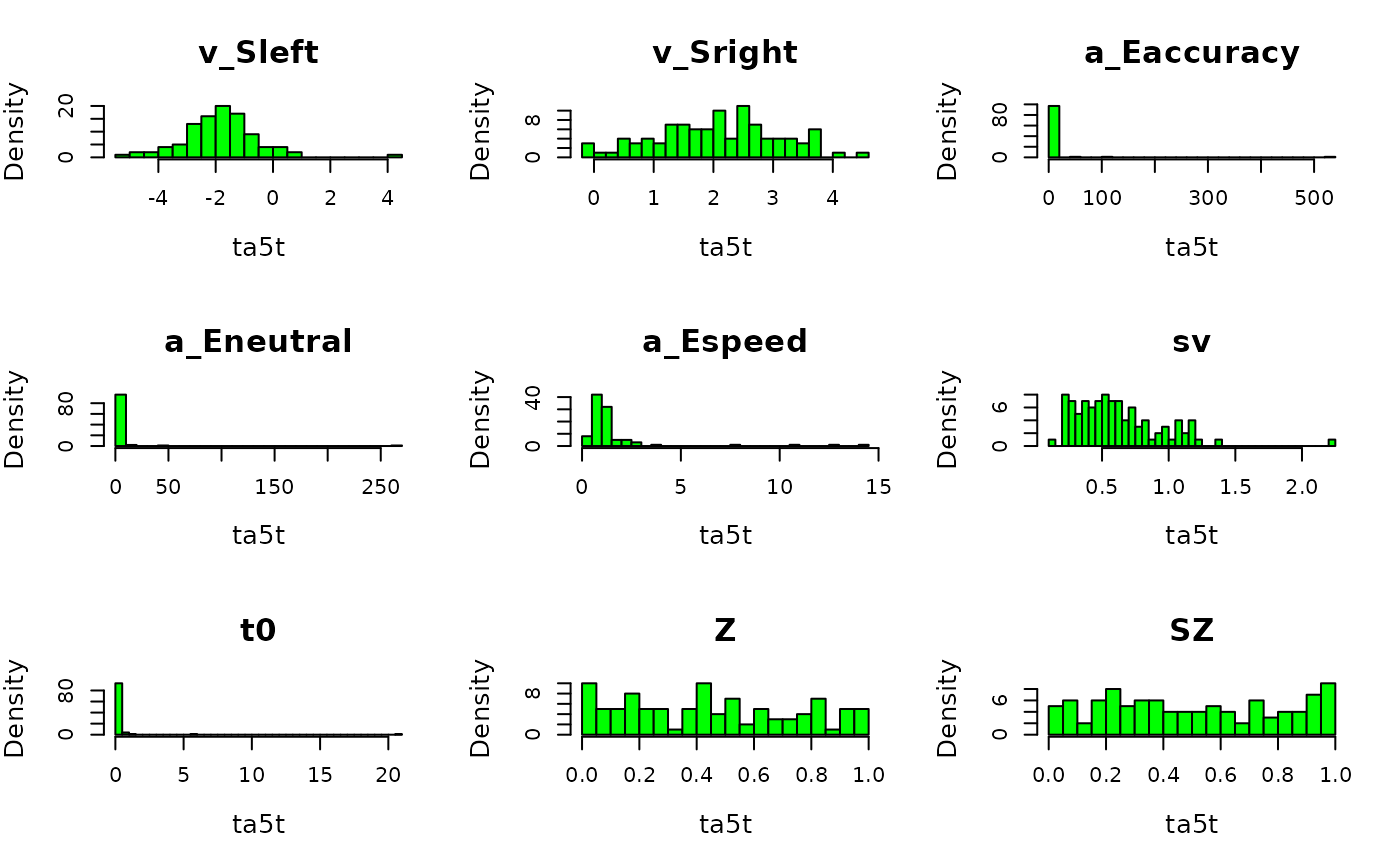
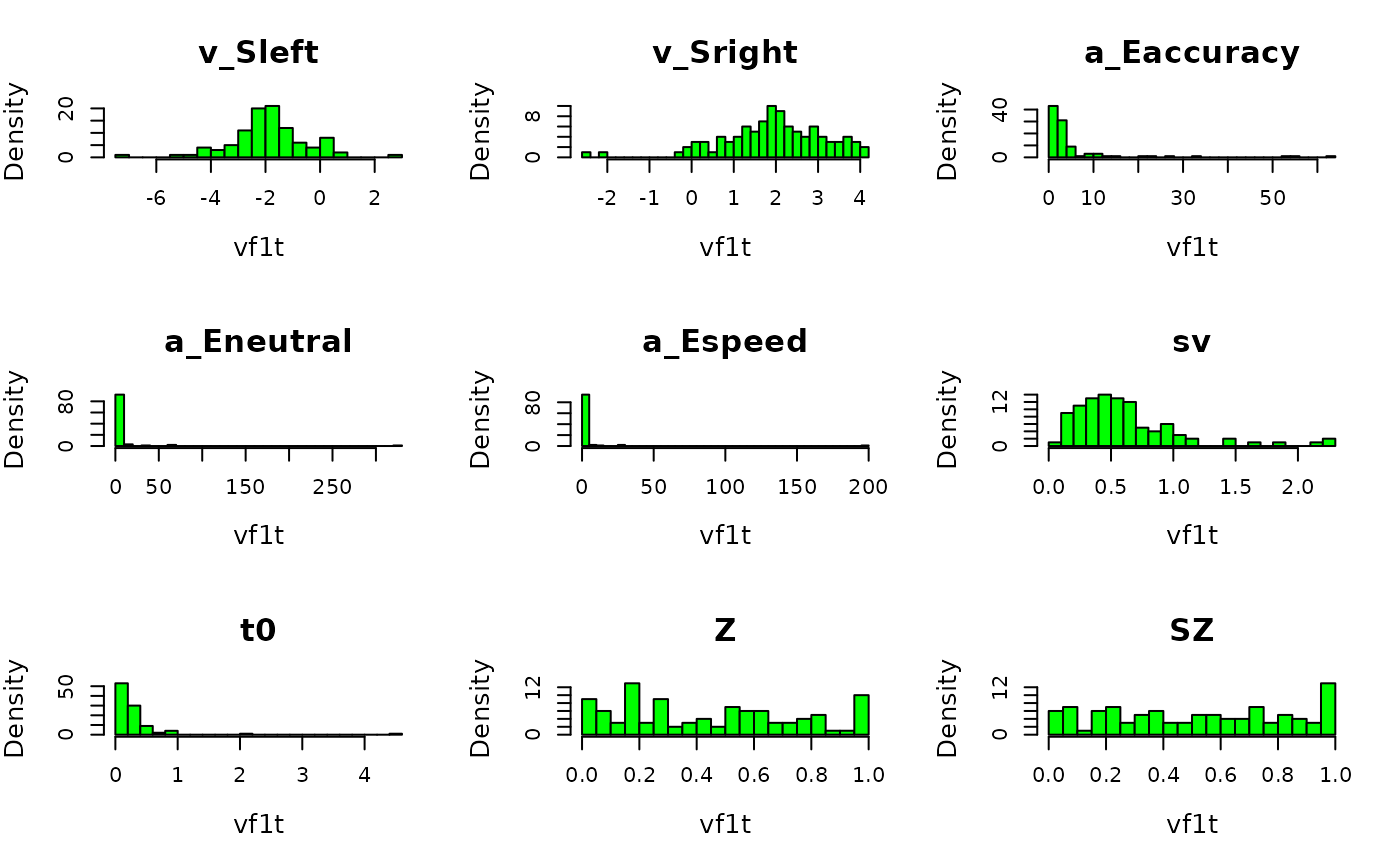
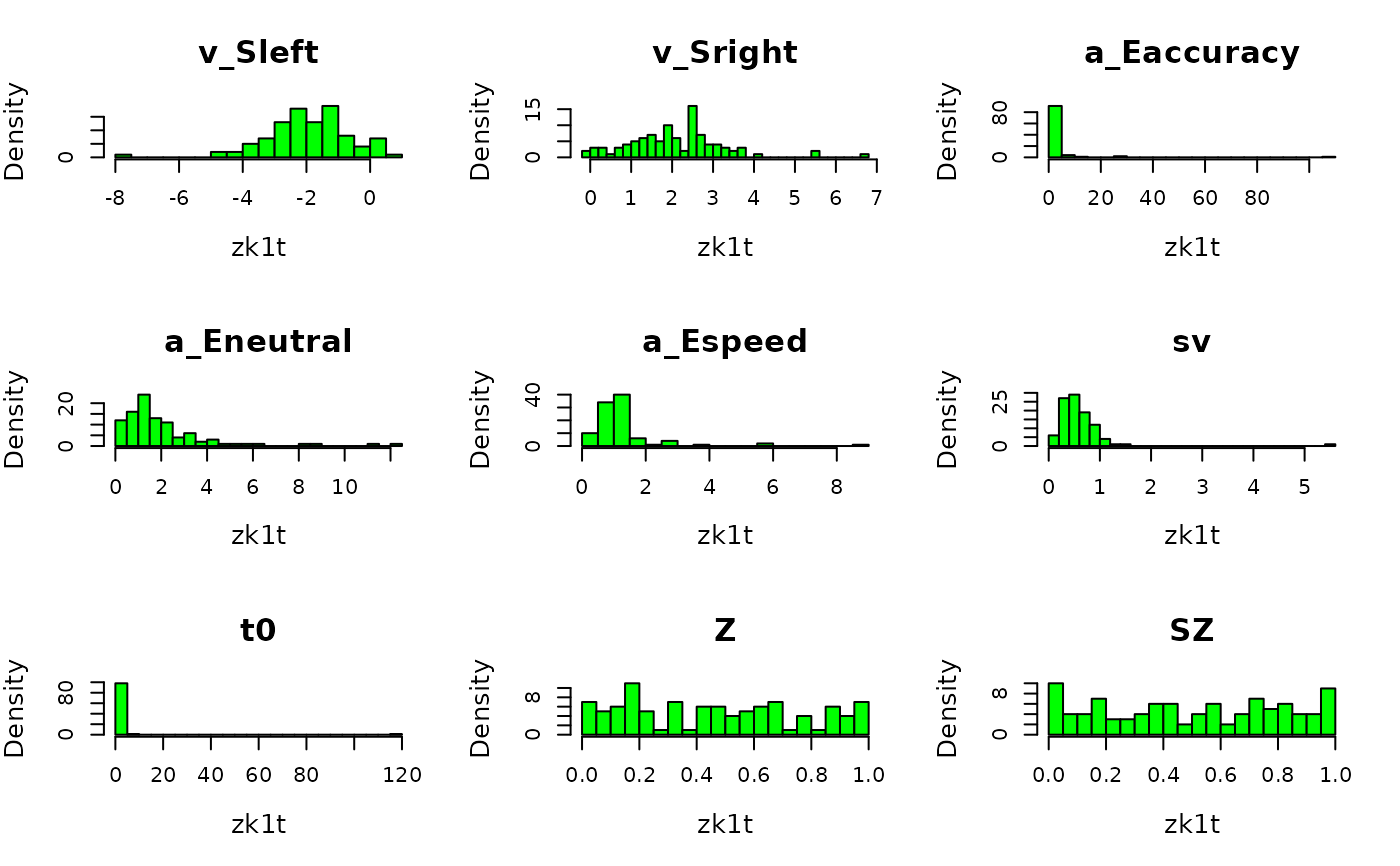
plot(prior_DDMaE, selection = "alpha", col = "green", N = 1e2)
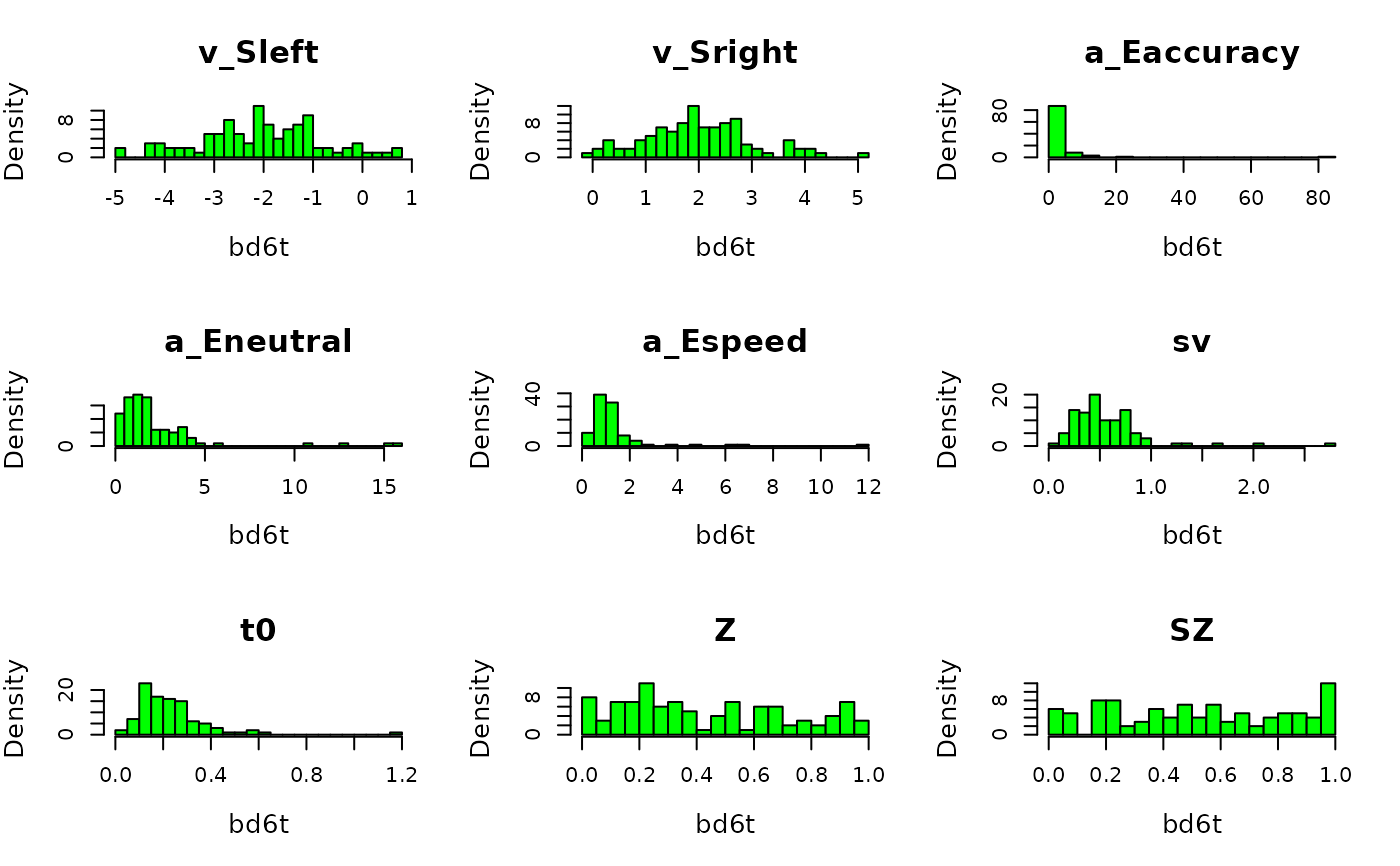
# We can also plot the implied prior on the participant level effects.
plot(prior_DDMaE, selection = "alpha", col = "green", N = 1e2)
 # }
# }