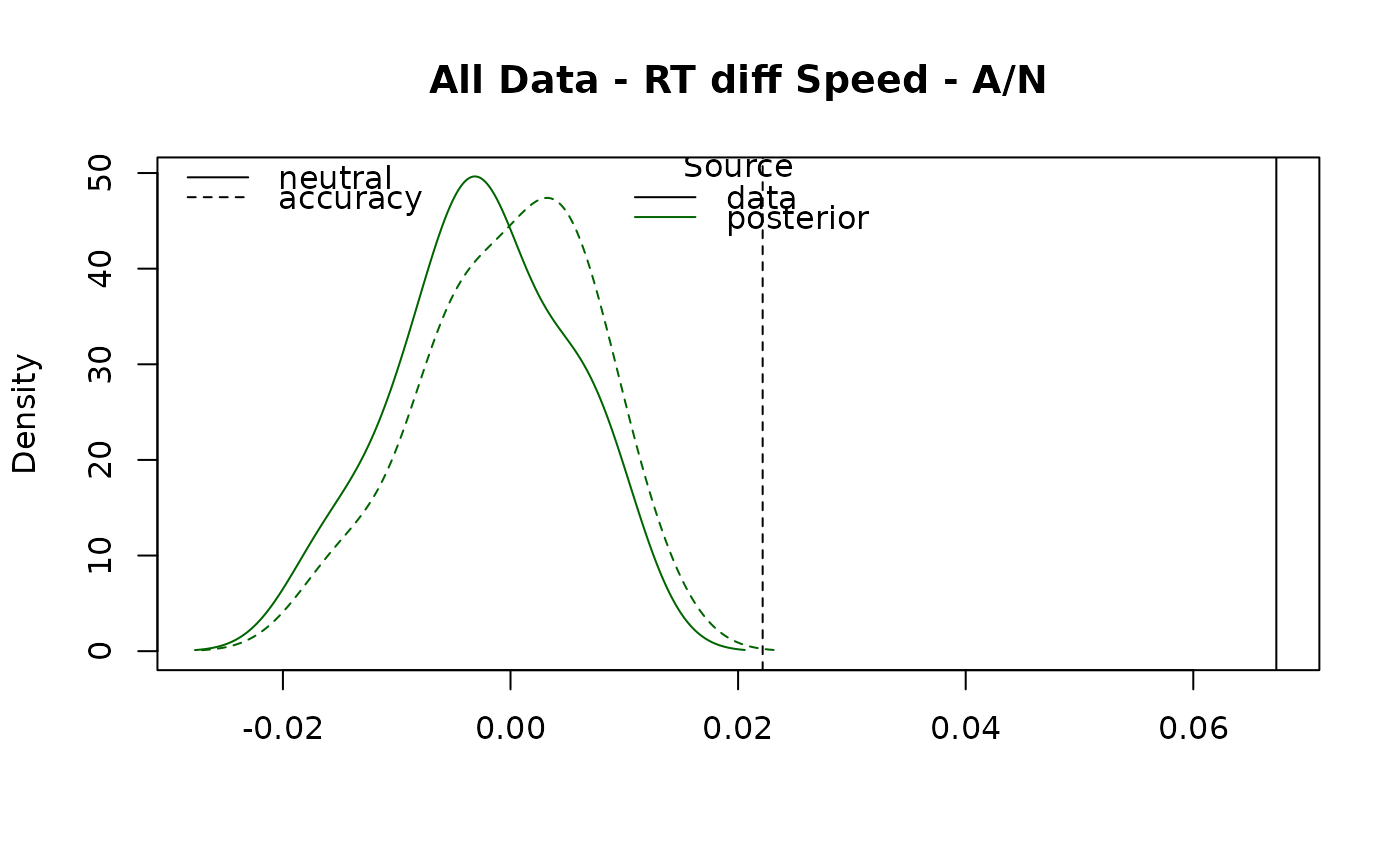
Plots panels that contain a set of densities for each level of the specified factor
The densities represent the predicted data across the posterior, the vertical lines represent the real data.
Usage
plot_stat(
  input,
  post_predict = NULL,
  prior_predict = NULL,
  stat_fun,
  stat_name = NULL,
  subject = NULL,
  factors = NULL,
  n_cores = 1,
  n_post = 50,
  quants = c(0.025, 0.5, 0.975),
  functions = NULL,
  layout = NA,
  to_plot = c("data", "posterior", "prior")[1:2],
  use_lim = c("data", "posterior", "prior")[1:2],
  legendpos = c("topleft", "top"),
  posterior_args = list(),
  prior_args = list(),
  ...
)
Arguments
- input
Either an
emcobject or a data frame, or a list of such objects.- post_predict
Optional posterior predictive data (matching columns) or list thereof.
- prior_predict
Optional prior predictive data (matching columns) or list thereof.
- stat_fun
A function that can be applied to the data and returns a single value or a vector of values.
- stat_name
The name of the calculated quantity
- subject
Subset the data to a single subject (by index or name).
- factors
Character vector of factor names to aggregate over; defaults to plotting full data set ungrouped by factors if
NULL.- n_cores
Number of CPU cores to use if generating predictives from an
emcobject.- n_post
Number of posterior draws to simulate if needed for predictives.
- quants
Numeric vector of credible interval bounds (e.g.
c(0.025, 0.975)).- functions
A function (or list of functions) that create new columns in the datasets or predictives
- layout
Numeric vector used in
par(mfrow=...); useNAfor auto-layout.- to_plot
Character vector: any of
"data","posterior","prior".- use_lim
Character vector controlling which source(s) define
xlim.- legendpos
Character vector controlling the positions of the legends
- posterior_args
Optional list of graphical parameters for posterior lines/ribbons.
- prior_args
Optional list of graphical parameters for prior lines/ribbons.
- ...
Other graphical parameters for the real data lines.