An adjusted version of the corrplot package function corrplot() tailored
to EMC2 and the plotting of estimated correlations.
Usage
plot_relations(
  emc = NULL,
  stage = "sample",
  plot_cred = FALSE,
  plot_means = TRUE,
  only_cred = TRUE,
  nice_names = NULL,
  selection = "correlation",
  use_par = NULL,
  ...
)
Arguments
- emc
An EMC2 object, commonly the output of
run_emc().- stage
Character. The stage from which to take the samples, defaults to the sampling stage
sample.- plot_cred
Boolean. Whether to plot the 95 percent credible intervals or not
- plot_means
Boolean. Whether to plot the means or not
- only_cred
Boolean. Whether to only plot credible values
- nice_names
Character string. Alternative names to give the parameters
- selection
Character. Whether to plot correlations or loadings
- use_par
Character. Which parameters to include. If null, includes all.
- ...
Optional additional arguments
Examples
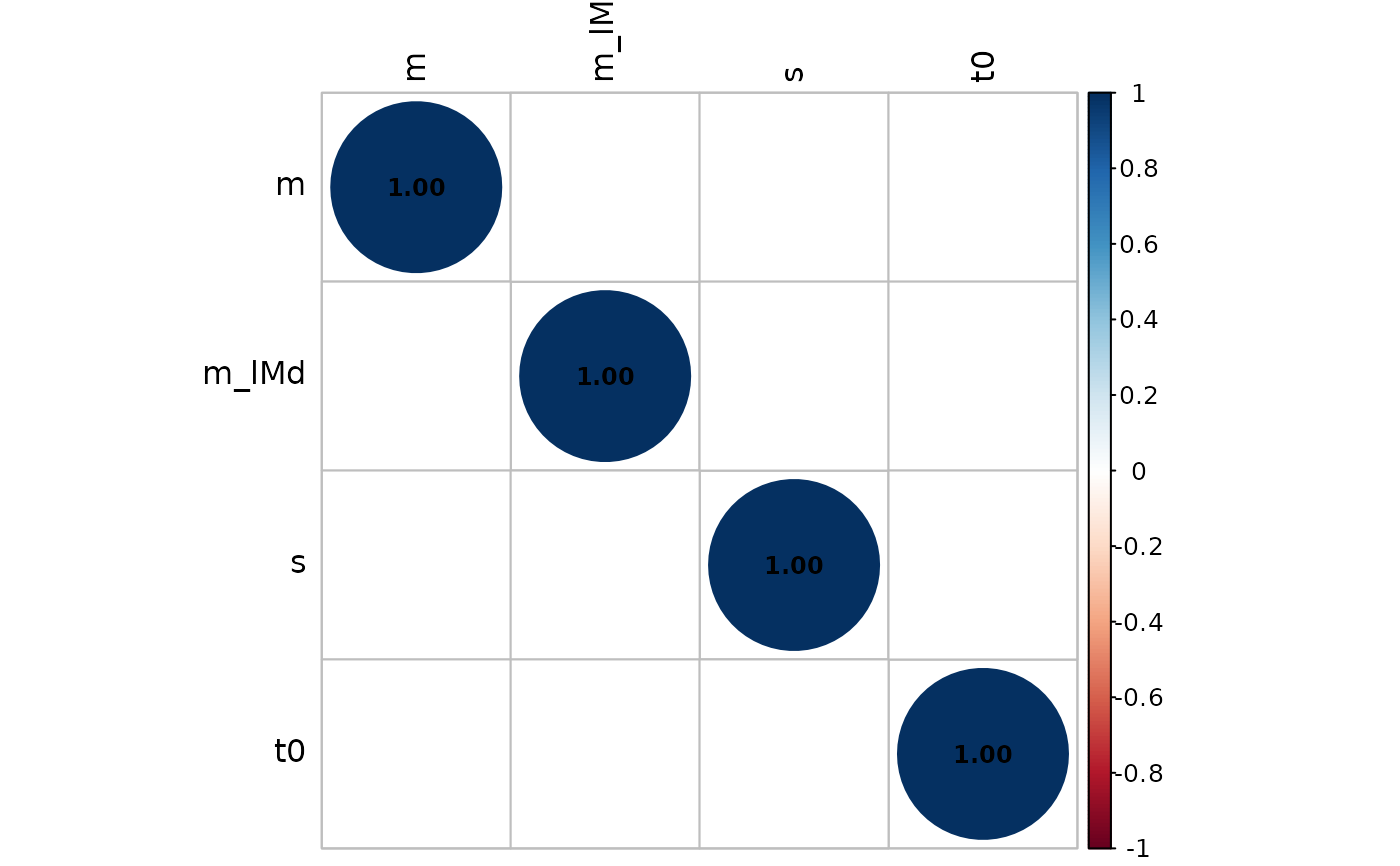
# For a given set of hierarchical model samples we can make a
# correlation matrix plot.
plot_relations(samples_LNR, only_cred = TRUE, plot_cred = TRUE)
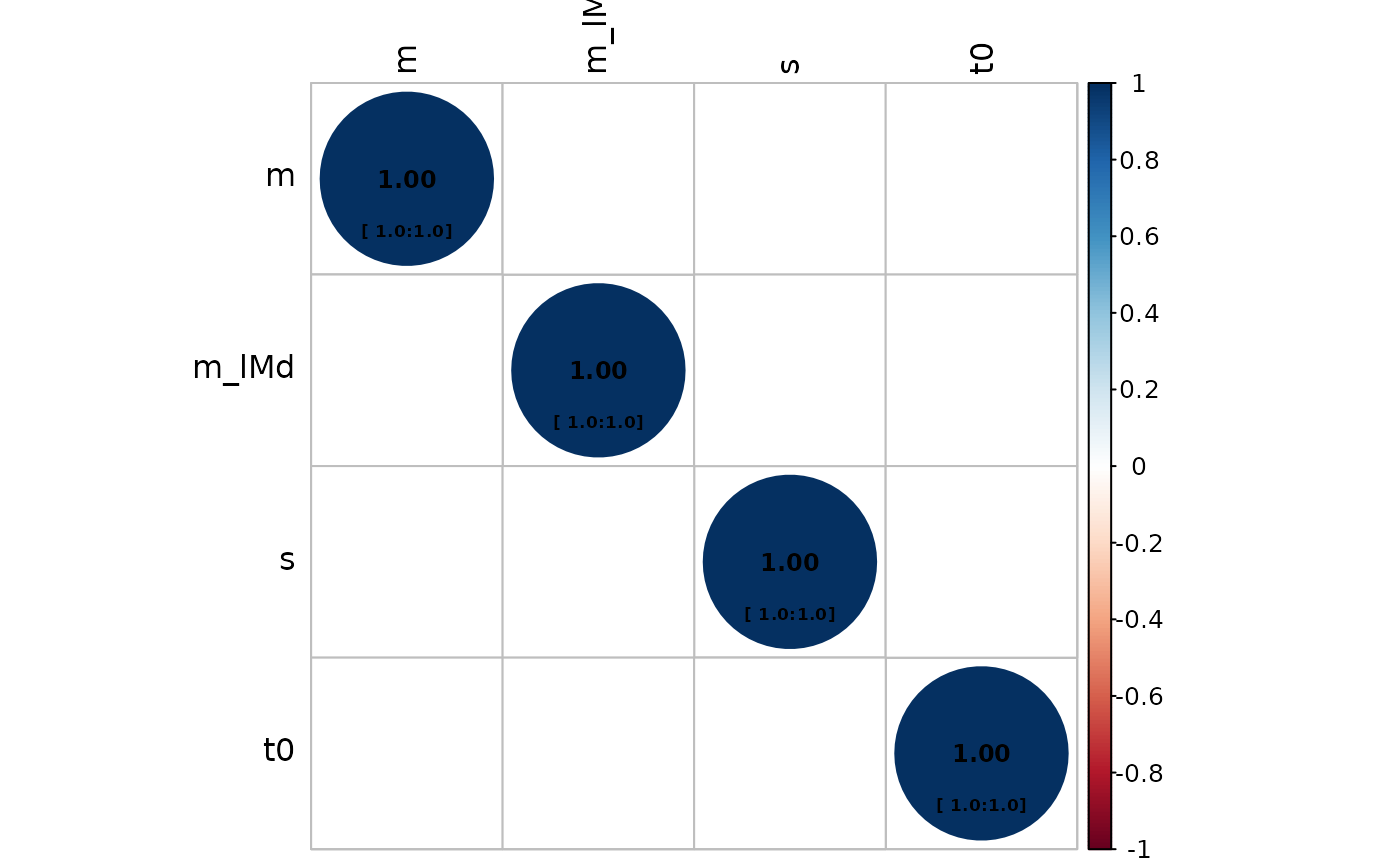 # We can also only plot the correlations where the credible interval does not include zero
plot_relations(samples_LNR, plot_means = TRUE, only_cred = TRUE)
# We can also only plot the correlations where the credible interval does not include zero
plot_relations(samples_LNR, plot_means = TRUE, only_cred = TRUE)