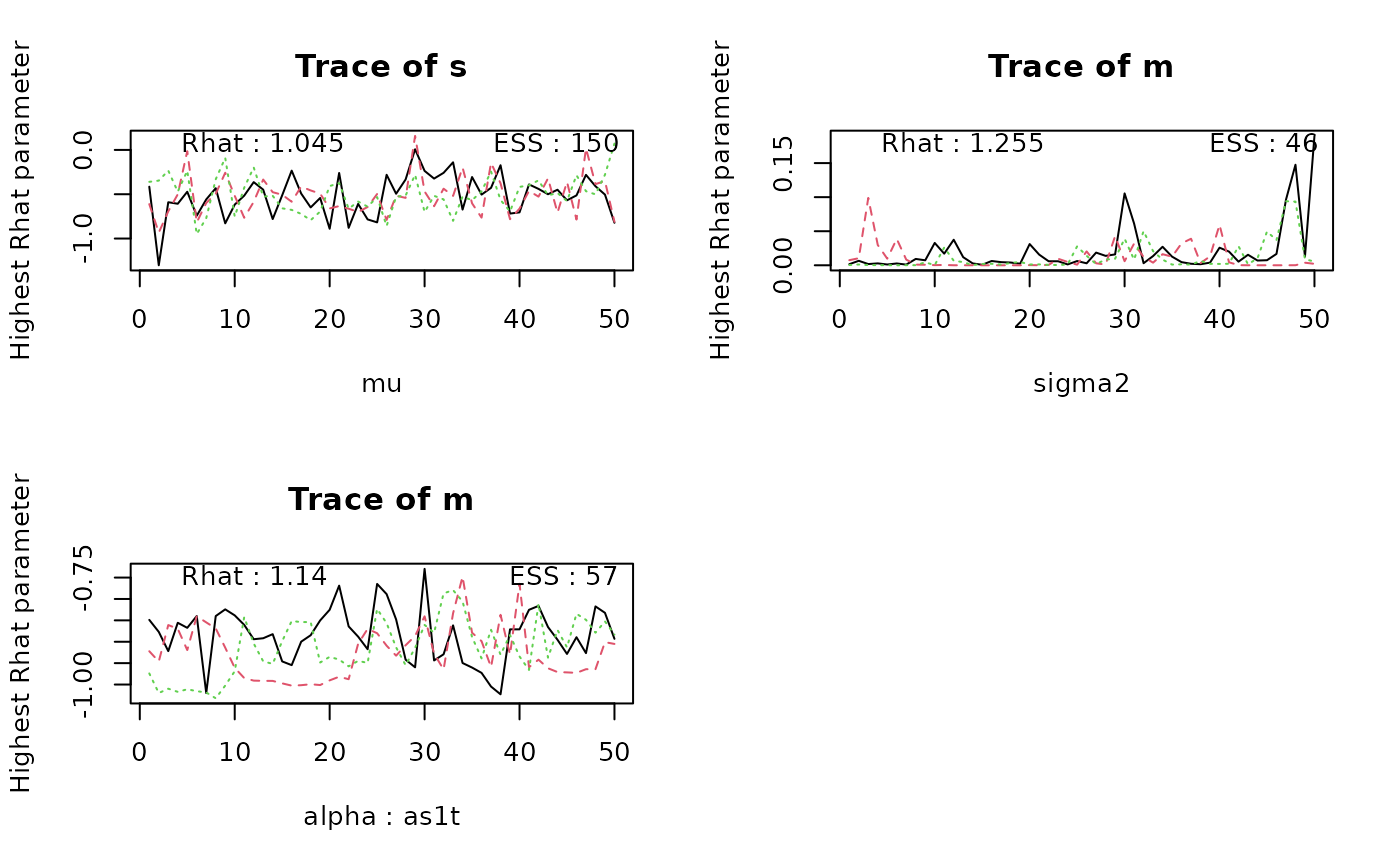
Runs a series of convergence checks, prints statistics to the console, and makes traceplots of the worst converged parameter per selection.
Usage
# S3 method for class 'emc'
check(
  emc,
  selection = c("mu", "sigma2", "alpha"),
  digits = 3,
  plot_worst = TRUE,
  ...
)

check(emc, ...)
Arguments
- emc
An emc object
- selection
A Character vector. Indicates which parameter types to check (e.g.,
alpha,mu,sigma2,correlation).- digits
Integer. How many digits to round the ESS and Rhat to in the plots
- plot_worst
Boolean. If
TRUEalso plots the chain plots for the worst parameter- ...
Optional arguments that can be passed to
get_parsorplot.default(seepar())
Details
Note that the Rhat is calculated by doubling the number of chains by
first splitting chains into first and second half, so it also a test of
stationarity.
Efficiency of sampling is indicated by the effective
sample size (ESS) (from the coda R package).
Full range of possible samples manipulations described in get_pars.
Examples
check(samples_LNR)
#> Iterations:
#>      preburn burn adapt sample
#> [1,]       0    0     0     50
#> [2,]       0    0     0     50
#> [3,]       0    0     0     50
#>
#>  mu
#>            m   m_lMd       s      t0
#> Rhat   1.066   1.017   1.035   1.006
#> ESS  150.000 178.000 150.000 143.000
#>
#>  sigma2
#>            m   m_lMd       s      t0
#> Rhat   1.032   1.003   1.003   0.993
#> ESS  133.000 115.000 150.000 150.000
#>
#>  alpha highest Rhat : bd6t
#>            m   m_lMd       s      t0
#> Rhat   1.039   0.995   1.004   1.029
#> ESS  140.000 150.000 600.000 158.000